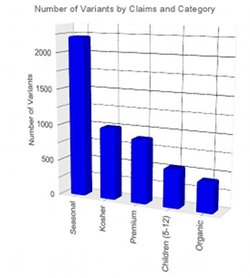
Graph and visualise your results
Mintel GNPD’s Plan-IT enables you to graph and tabulate search results to view both competitor’ launch patterns and the development of trends within categories of interest. Plan-IT is unrestricted meaning you can graph or tabulate the results of any search you have run. Search for a company to analyse where it has been launching, what claims or flavours it has been using, what brands have seen the highest activity, what pack types are being used in what categories… since 1996. Search for a category to analyse what claim, flavour, fragrance, pack type, material, etc trends are occurring since 1996.
Case study 1:To spot emerging trends in their categories
To help one confectionery client spot what was happening in its categories, it used Plan-IT to review product claim and packaging trends along with where products are being launched. By analysing the data in this way it is able to establish development schedules in certain countries. Knowing that its market closely follows the US, it reviews in more depth what is happening there to regularly spot emerging trends. In one case this planning enabled it to have a product ready for launch as the trend arrived in its country.
Case study 2:To locate their competitors' test markets
Studying both launch patterns and claim patterns revealed its competitors’ reaction to a new trend. For this beverage client enabled it to examine test markets and emerging categories. Following this it set up alerts for these emerging categories, keeping them aware of these developing trends. In one country it was able to establish an interrelated launch pattern for two categories meaning it could target when it launched its products in these sectors.
To see a sample of Plan-IT charts, working alongside the other Mintel GNPD elements,现在立刻免费申请您的网上示例。